Comments Stats Surface Trends Hidden in Written Feedback
When people think of the data stored in Edthena, they usually think of comments on videos. At any specific moment, it’s possible to leave a detailed analysis of what you’re seeing as an observer.
The substance of each comment is valuable to the teacher when viewing that specific video. But as time passes and more videos are analyzed, each specific comment becomes harder and harder to remember.
How do we know which areas are strengths of our teachers over time, and which areas they’re still working to improve, based on the video observations?
To help answer this type of question (and others) we’ve built a new way to visualize the comments using the data we store about the comments.
We’re calling this Comment Stats.
Instant Graph-ification
What’s exciting about this new data tool is that it doesn’t require any extra work on the part of users. It uses the automatically captured data about comment types as well as any tags to professional standards.
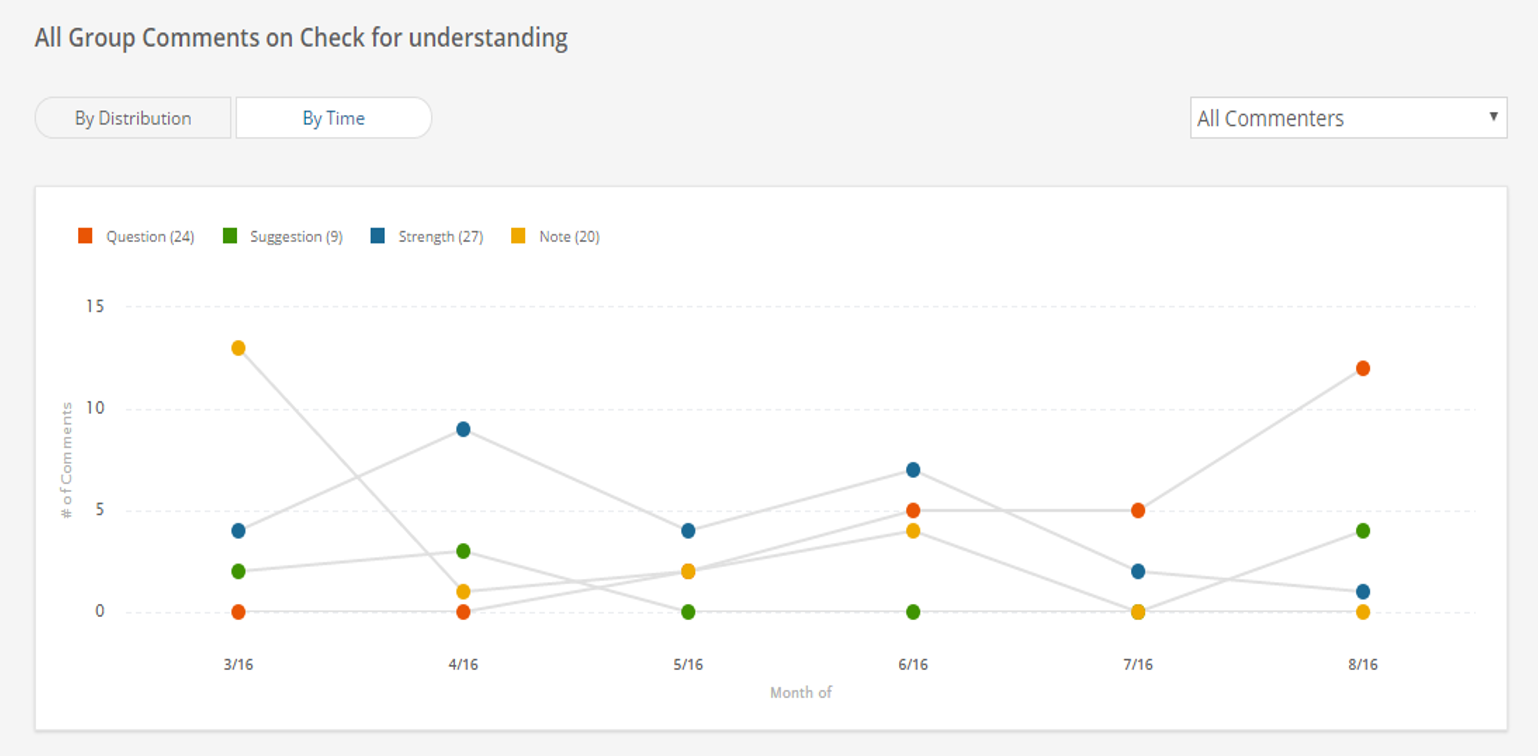
For example, a comment about “Checks for understanding” that’s categorized as a strength is meaningfully different than a similarly tagged comment categorized as a suggestion. And with Comment Stats, we can know whether the pattern of comment types has changed over time.
This type of data visualization is only possible with the data captured by Edthena’s patented tools. These stats are in addition to Leveled Indicators which are tied to professional learning cycles.
Zoom out to see comment trends
Like most features in Edthena, the new Comment Stats were developed using feedback from our existing partners. We want to make sure these graphs and charts are useful!
Something learned by talking to coaches is that they are interested in separating the teacher’s self-reflection comments from the comments of peers. For one coach, she mentioned that this would give her insight into individual teacher noticing skills.
The stats are also calculated on a whole-group and teacher-by-teacher basis.
Aggregating data at the group level offers decision makers the ability to analyze their PD program. The comment data can help match the actual feedback areas against the anticipated “dosing” for building or district-level priorities.
For example, if a building is prioritizing the use of academic language in the content areas this year, but they only have a few comments where this is noticed throughout the fall, it would indicate that more attention is necessary.
And for the number-cruncher types out there, we also calculate some simple averages across the group to help understand any individual teachers’ data in a comparative context of the whole group. Looking to do an in-depth analysis in SPSS? We’ve got you covered there, too, with a CSV download of all comments and associated metadata.


